- 4192 Devonwood Way, Ashburn, Virginia, 20148
- Helpline: +1 (703) 665-3747
Transcriptomic Changes Associated with Uveal Melanoma Metastasis
- Home
- Back to Journal
- Article Details
Abstract
Purpose: Survival of patients affected by Uveal Melanoma (UM), a major intraocular cancer, is greatly reduced by the development of metastasis. However, the molecular tumor characteristics associated with metastasis are unclear. The purpose of this study was to discover differential gene expression among non-metastatic and metastatic UM patients and to evaluate their prognostic significance.
Methods: We utilized the UM RNA-seq dataset from The Cancer Genome Atlas (TCGA) to discover the genes associated with UM metastasis and patient survival. Differential expression analyses between metastatic and non-metastatic tumors were performed. The hazard ratios were computed to correlate differentially expressed genes with patient survival. Bioinformatics analyses were also conducted to identify associated biological functions and pathways.
Results: A total of 646 genes were differentially expressed between metastatic and non-metastatic tumors and 328 genes were significantly correlated with patient survival. The top five genes upregulated in metastasis and negatively associated with patient survival include: HTR2B, RIMS2, VGF, MYEOV, and ISM1. The top five genes downregulated in metastasis and positively associated with patient survival include: GSAT3, GATA4, MYO7B, COL11A1, and SYNPR. Functional annotation of these genes revealed a number of molecular and cellular functions including cell movement, growth, proliferation, cell junction, and transporter activity.
Conclusion: We identified several differentially expressed genes associated with metastasis in UM patients which correlated significantly with patient survival. Several genes are associated with cell movement and homeostasis, indicating their significance in metastasis. The findings from this study may aid in the development of prognostic and predictive biomarkers for metastatic UM.
Keywords: uveal melanoma, metastasis, survival, gene expression
Introduction
Uveal melanoma (UM) is the most primary intraocular malignancy, and unlike nearly all other cancers, the 5-year survival rate has not improved over the past 40 years [1, 2]. Approximately half of all UM patients eventually develop metastases - most commonly to the liver (~89%), lung (~29%), and bone (~17%) [3, 4]. Metastasis bodes poorly with the survival, with the median patient survival ranging from 4 to 15?months and one-year survival being only ~20% [5–12]. No adjuvant therapy after treatment of the primary tumor has been shown to prevent the development of metastasis [13]. Advances in molecular-targeted therapies have improved the survival of patients with Cutaneous Melanomas (CM), however, these therapies are ineffective in UM [6]. This likely is related to different underlying mutations between UM and CM (CM candidate genes CDKN2A, p14ARF, CDK4 were either not present or observed at a low frequency in UM patients), highlighting clear molecular differences between uveal and cutaneous melanomas [14].
Several genetic alterations, including copy number variations and somatic mutations, are reported in UM [15]. The most frequent chromosomal aberrations encountered in UM are monosomy of chromosome 3 (the strongest cytogenetic factor associated with metastasis), and amplification of 8q [16–18]. The majority of metastatic UM present with a mutated allele of the BAP1, which behaves like a classic tumor suppressor [19]. The amplification on chromosome 6q25.2 near the CNKSR3 gene prolongs metastasis-free survival in a rare subset of UM [20]. The mutations in GNAQ and GNA11, which encode for Gα subunits of G proteins, are present in over 80% of UM [21]. Amplification of these genes leads to the stimulation of several pathways, including Akt, protein kinase C (PKC), phosphoinositide 3-kinase (PI3K), and the mechanistic target of rapamycin (mTOR), which are involved in cancer cell proliferation and metastasis [21]. Given the wide range of chromosomal and genetic alterations, gene expression profiling of UM might offer valuable insights into the molecular mechanisms underlying disease pathogenesis and prognosis [15, 18, 22–31].
The rarity of uveal melanoma (incidence: ~5 per million) presents a big challenge for studies designed to identify molecular signatures associated with UM metastasis [32]. The Cancer Genome Atlas (TCGA) is a valuable resource containing gene expression data from 80 UM patients (http://cancergenome.nih.gov/). Utilizing the high quality TCGA RNA-Seq UM dataset, we discovered differentially expressed genes between primary tumor of patients who developed metastasis and those without metastasis. Further, the prognostic potential of these gene expression changes in relation to patient survival was also evaluated.
Materials And Methods
Dataset
The uveal melanoma RNA-seq dataset was downloaded from the TCGA consortium (https: //portal.gdc.cancer.gov/). The dataset includes the expression data of 20,530 genes from 80 UM patients with accompanying clinical information on survival and metastatic status.
Differential Expression Analysis
Statistical analyses were performed using the R language and environment for statistical computing (R version 3.5.2; R Foundation for Statistical Computing; www.r-project.org). After normalization of the gene expression data, differential expression analyses were performed between primary UM tumors with and without metastasis using the “limma” package [33]. The p-values were adjusted using the false discovery rate (FDR) method and genes with adjusted p-values <0.01 and fold-change >2 were considered to be differentially expressed.
Survival Analysis
For each gene, subjects were separated into high- or low-expression groups relative to the median gene expression value. Cox proportional hazard models were then used to perform survival analyses. The hazard ratios (HR) were computed, and p-values were adjusted using the FDR method. Genes with adjusted p-value <0.01 were considered to be significantly associated with patient survival. Concordance was also measured to evaluate the performance of the survival models.
Pathway and Network Analyses
Genes associated with UM metastasis and patient survival were submitted to the Database for Annotation, Visualization and Integrated Discovery (DAVID ) v6.8 [34, 35] in an attempt to deduce involved biological pathways, cellular compartments, and molecular functions. Similarly, Ingenuity Pathway Analysis (IPA) software was used for network analysis to display the interactions between these genes.
Results
Gene Expression Changes Associated with Metastasis
A total of 646 genes were differentially expressed with a 2-fold or more up- or down-regulation between the metastatic and non-metastatic subjects (adjusted p-value <0.01). A volcano plot visualizing the results of the differential expression analysis is shown in Figure 1. The number of upregulated and downregulated genes in metastatic UM, using different Fold-Change (FC) cutoffs (2-, 3-, 4-, 5-, and 10-fold) are presented in Table 1.
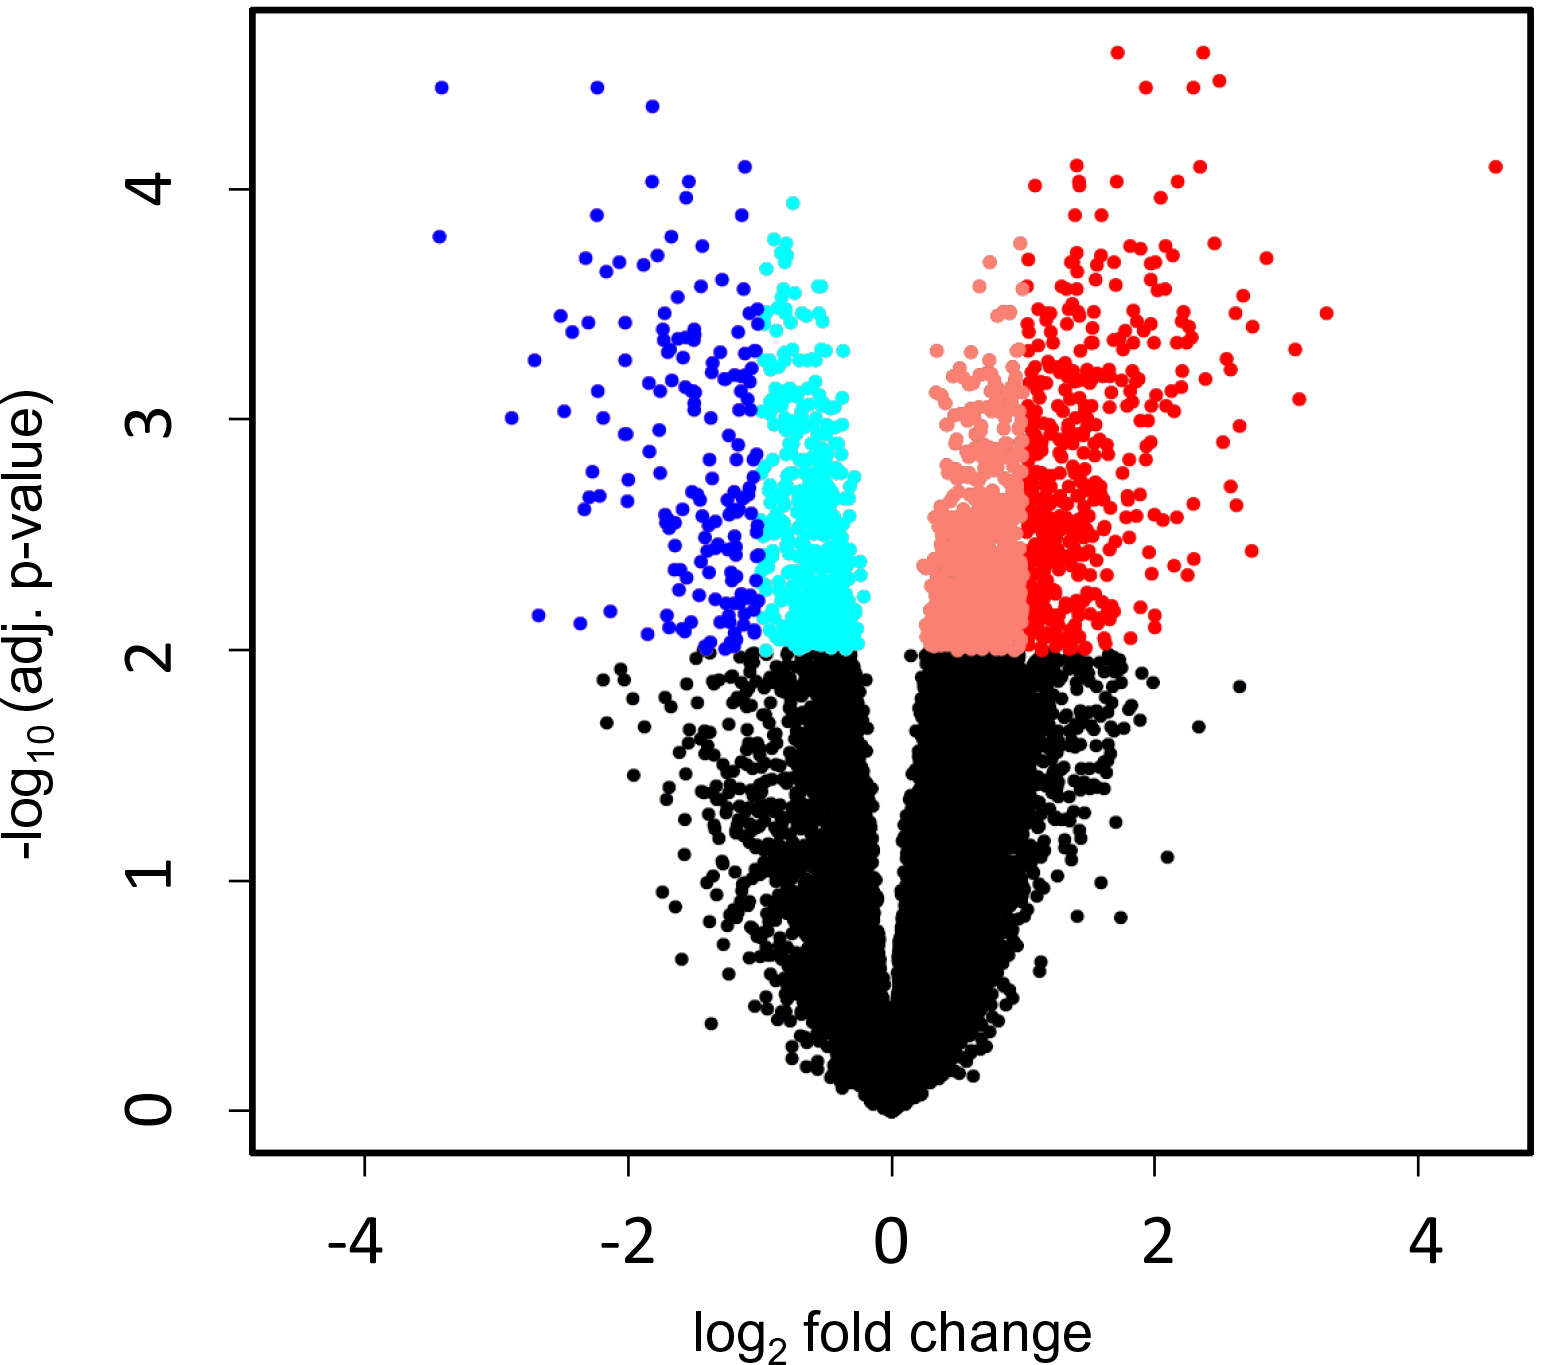
Figure 1: Volcano plot visualizing the results of differential expression analysis. Each dot represent one gene. Red dots represent significantly upregulated genes and blue dots represent significantly downregulated genes in metastatic UM.
Table 1: Number of genes differentially expressed in metastatic uveal melanoma at different fold-change cut-off values.
|
Fold-Change |
Number of genes |
||||
|
>2-fold |
>3-fold |
>4-fold |
>5-fold |
>10-fold |
|
|
Metastasis |
646 |
178 |
76 |
31 |
3 |
|
Upregulated |
469 |
118 |
48 |
20 |
2 |
|
Downregulated |
177 |
60 |
28 |
11 |
1 |
|
Metastasis and Survival |
328 |
126 |
56 |
26 |
3 |
The most upregulated genes in the metastatic UM include 5-hydroxytryptamine receptor 2B (HTR2B; FC: 24.1), regulating synaptic membrane exocytosis 2 (RIMS2; FC: 9.9), VGF nerve growth factor (VGF; FC: 8.6), myeloma overexpressed (MYEOV; FC: 8.4), isthmin-1 (ISM1; FC: 7.2), carbonic anhydrase-12 (CA12; FC: 6.7), phospholamban (PLN; FC: 6.7), potassium voltage-gated channel subfamily Q member 2 (KCNQ2; FC: 6.4), SSX family member 5 (SSX5; FC: 6.3), and carbonic anhydrase 8 (CA8; FC: 5.97) (Table 2).
Table 2: Top 20 genes upregulated in metastatic uveal melanoma.
|
Gene symbol |
Name |
FC |
p-value |
HR |
p-value |
Concordance |
|
HTR2B |
5-hydroxytryptamine receptor 2B |
24.12 |
8.00E-05 |
5.85 |
0.007 |
0.69 |
|
RIMS2 |
Regulating synaptic membrane exocytosis 2 |
9.91 |
0.0003 |
6.79 |
0.005 |
0.71 |
|
VGF |
VGF nerve growth factor inducible |
8.58 |
0.0008 |
8.71 |
0.005 |
0.72 |
|
MYEOV |
Myeloma overexpressed |
8.38 |
0.0005 |
7.33 |
0.005 |
0.70 |
|
ISM1 |
Isthmin 1 |
7.22 |
0.0002 |
10.07 |
0.005 |
0.77 |
|
CA12 |
Carbonic anhydrase 12 |
6.70 |
0.0004 |
10.64 |
0.005 |
0.77 |
|
PLN |
Phospholamban |
6.67 |
0.0037 |
5.93 |
0.007 |
0.70 |
|
KCNQ2 |
Potassium voltage-gated channel Q 2 |
6.38 |
0.0003 |
9.12 |
0.005 |
0.72 |
|
SSX5 |
SSX family member 5 |
6.26 |
0.0011 |
17.33 |
0.005 |
0.75 |
|
CA8 |
Carbonic anhydrase 8 |
5.97 |
0.0006 |
4.44 |
0.008 |
0.70 |
|
SLCO5A1 |
Solute carrier organic anion transporter 5A1 |
5.84 |
0.0005 |
4.90 |
0.008 |
0.71 |
|
ST8SIA2 |
ST8 sialyltransferase 2 |
5.63 |
3.36E-05 |
14.13 |
0.005 |
0.74 |
|
DOCK10 |
Dedicator of cytokinesis 10 |
5.48 |
0.0002 |
5.44 |
0.008 |
0.70 |
|
MATK |
Megakaryocyte-associated tyrosine kinase |
5.23 |
0.0007 |
5.91 |
0.005 |
0.72 |
|
SLC1A1 |
Solute carrier family 1 member 1 |
5.17 |
2.54E-05 |
9.65 |
0.005 |
0.75 |
|
PSD2 |
Pleckstrin and Sec7 domain containing 2 |
5.09 |
8.00E-05 |
6.77 |
0.005 |
0.74 |
|
CADM1 |
Cell adhesion molecule 1 |
4.91 |
3.62E-05 |
11.01 |
0.005 |
0.76 |
|
EEF1A2 |
Eukaryotic translation elongation factor 1α2 |
4.91 |
0.0023 |
5.11 |
0.007 |
0.67 |
|
CARD11 |
Caspase recruitment domain family 11 |
4.86 |
0.0004 |
18.92 |
0.005 |
0.78 |
|
TNFRSF19 |
TNF receptor superfamily member 19 |
4.79 |
0.0004 |
10.13 |
0.005 |
0.76 |
FC: Fold change; HR: Hazards Ratio
The most downregulated genes in patients with UM metastasis include glutathione S-transferase alpha 3 (GSTA3; FC: 10.8), GATA binding protein 4 (GATA4; FC: 10.7), myosin VIIB (MYO7B; FC: 7.4), collagen type XI alpha 1 chain (COL11A1; FC: 6.6), synaptoporin (SYNPR; FC: 6.4), cytochrome c oxidase subunit 6A2 (COX6A2; FC: 5.4), musculin (MSC; FC: 5.04), cardiotrophin-1 (CTF1; FC: 5), embryonal Fyn-associated substrate (EFS; FC: 4.93), interleukin 12 receptor subunit beta 2 (IL12RB2; FC: 4.84), and ectonucleotide pyrophosphatase (ENPP2: FC: 4.73) (Table 3).
Table 3: Top 20 genes downregulated in metastasis developing uveal melanoma.
|
Symbol |
Name |
FC |
p value |
HR |
p value |
Concordance |
|
GSTA3 |
Glutathione S-transferase alpha 3 |
-10.81 |
0.0002 |
0.07 |
0.005 |
0.77 |
|
GATA4 |
GATA binding protein 4 |
-10.71 |
3.62E-05 |
0.04 |
0.008 |
0.74 |
|
MYO7B |
Myosin VIIB |
-7.40 |
0.0010 |
0.18 |
0.008 |
0.70 |
|
COL11A1 |
Collagen type XI alpha 1 chain |
-6.56 |
0.0006 |
0.17 |
0.005 |
0.74 |
|
SYNPR |
Synaptoporin |
-6.42 |
0.0070 |
0.13 |
0.005 |
0.68 |
|
C6orf142 |
Muscular LMNA interacting protein |
-5.73 |
0.0004 |
0.09 |
0.005 |
0.76 |
|
LOC100188947 |
Uncharacterized antisense RNA |
-5.61 |
0.0009 |
0.13 |
0.006 |
0.73 |
|
COX6A2 |
Cytochrome c oxidase subunit 6A2 |
-5.38 |
0.0004 |
0.11 |
0.005 |
0.72 |
|
MSC |
Musculin |
-5.04 |
0.0025 |
0.14 |
0.005 |
0.69 |
|
CTF1 |
Cardiotrophin 1 |
-5.01 |
0.0002 |
0.09 |
0.005 |
0.75 |
|
EFS |
Embryonal Fyn-associated substrate |
-4.93 |
0.0004 |
0.05 |
0.005 |
0.77 |
|
C3orf32 |
Ssu-2 homolog (C. elegans) |
-4.92 |
0.0022 |
0.14 |
0.005 |
0.76 |
|
IL12RB2 |
Interleukin 12 receptor subunit β2 |
-4.84 |
0.0017 |
0.07 |
0.005 |
0.75 |
|
ENPP2 |
Ectonucleotide pyrophosphatase |
-4.73 |
0.0001 |
0.09 |
0.005 |
0.76 |
|
LIMS2 |
LIM zinc finger domain |
-4.71 |
3.62E-05 |
0.15 |
0.005 |
0.75 |
|
MPZ |
Myelin protein zero |
-4.70 |
0.0008 |
0.08 |
0.005 |
0.78 |
|
ZNF835 |
Zinc finger protein 835 |
-4.56 |
0.0010 |
0.03 |
0.005 |
0.77 |
|
AZGP1 |
Alpha-2-glycoprotein 1 |
-4.50 |
0.0002 |
0.10 |
0.005 |
0.73 |
|
ERVFRDE1 |
Endogenous retrovirus grp FRD1 |
-4.19 |
0.0002 |
0.09 |
0.006 |
0.75 |
|
CLEC11A |
C-type lectin domain 11A |
-4.07 |
0.0004 |
0.06 |
0.005 |
0.75 |
Gene Expression Changes Correlated with Patient Survival
Considering the results of the Cox proportional hazard analysis of 646 differentially expressed genes 328 were significantly correlated to patient survival. Out of 76 genes with >4-fold change between non-metastatic and metastatic cases, 56 significantly correlated with patient survival. A heatmap representing gene expression values of these 56 genes in all 80 patients is shown in Figure 2.
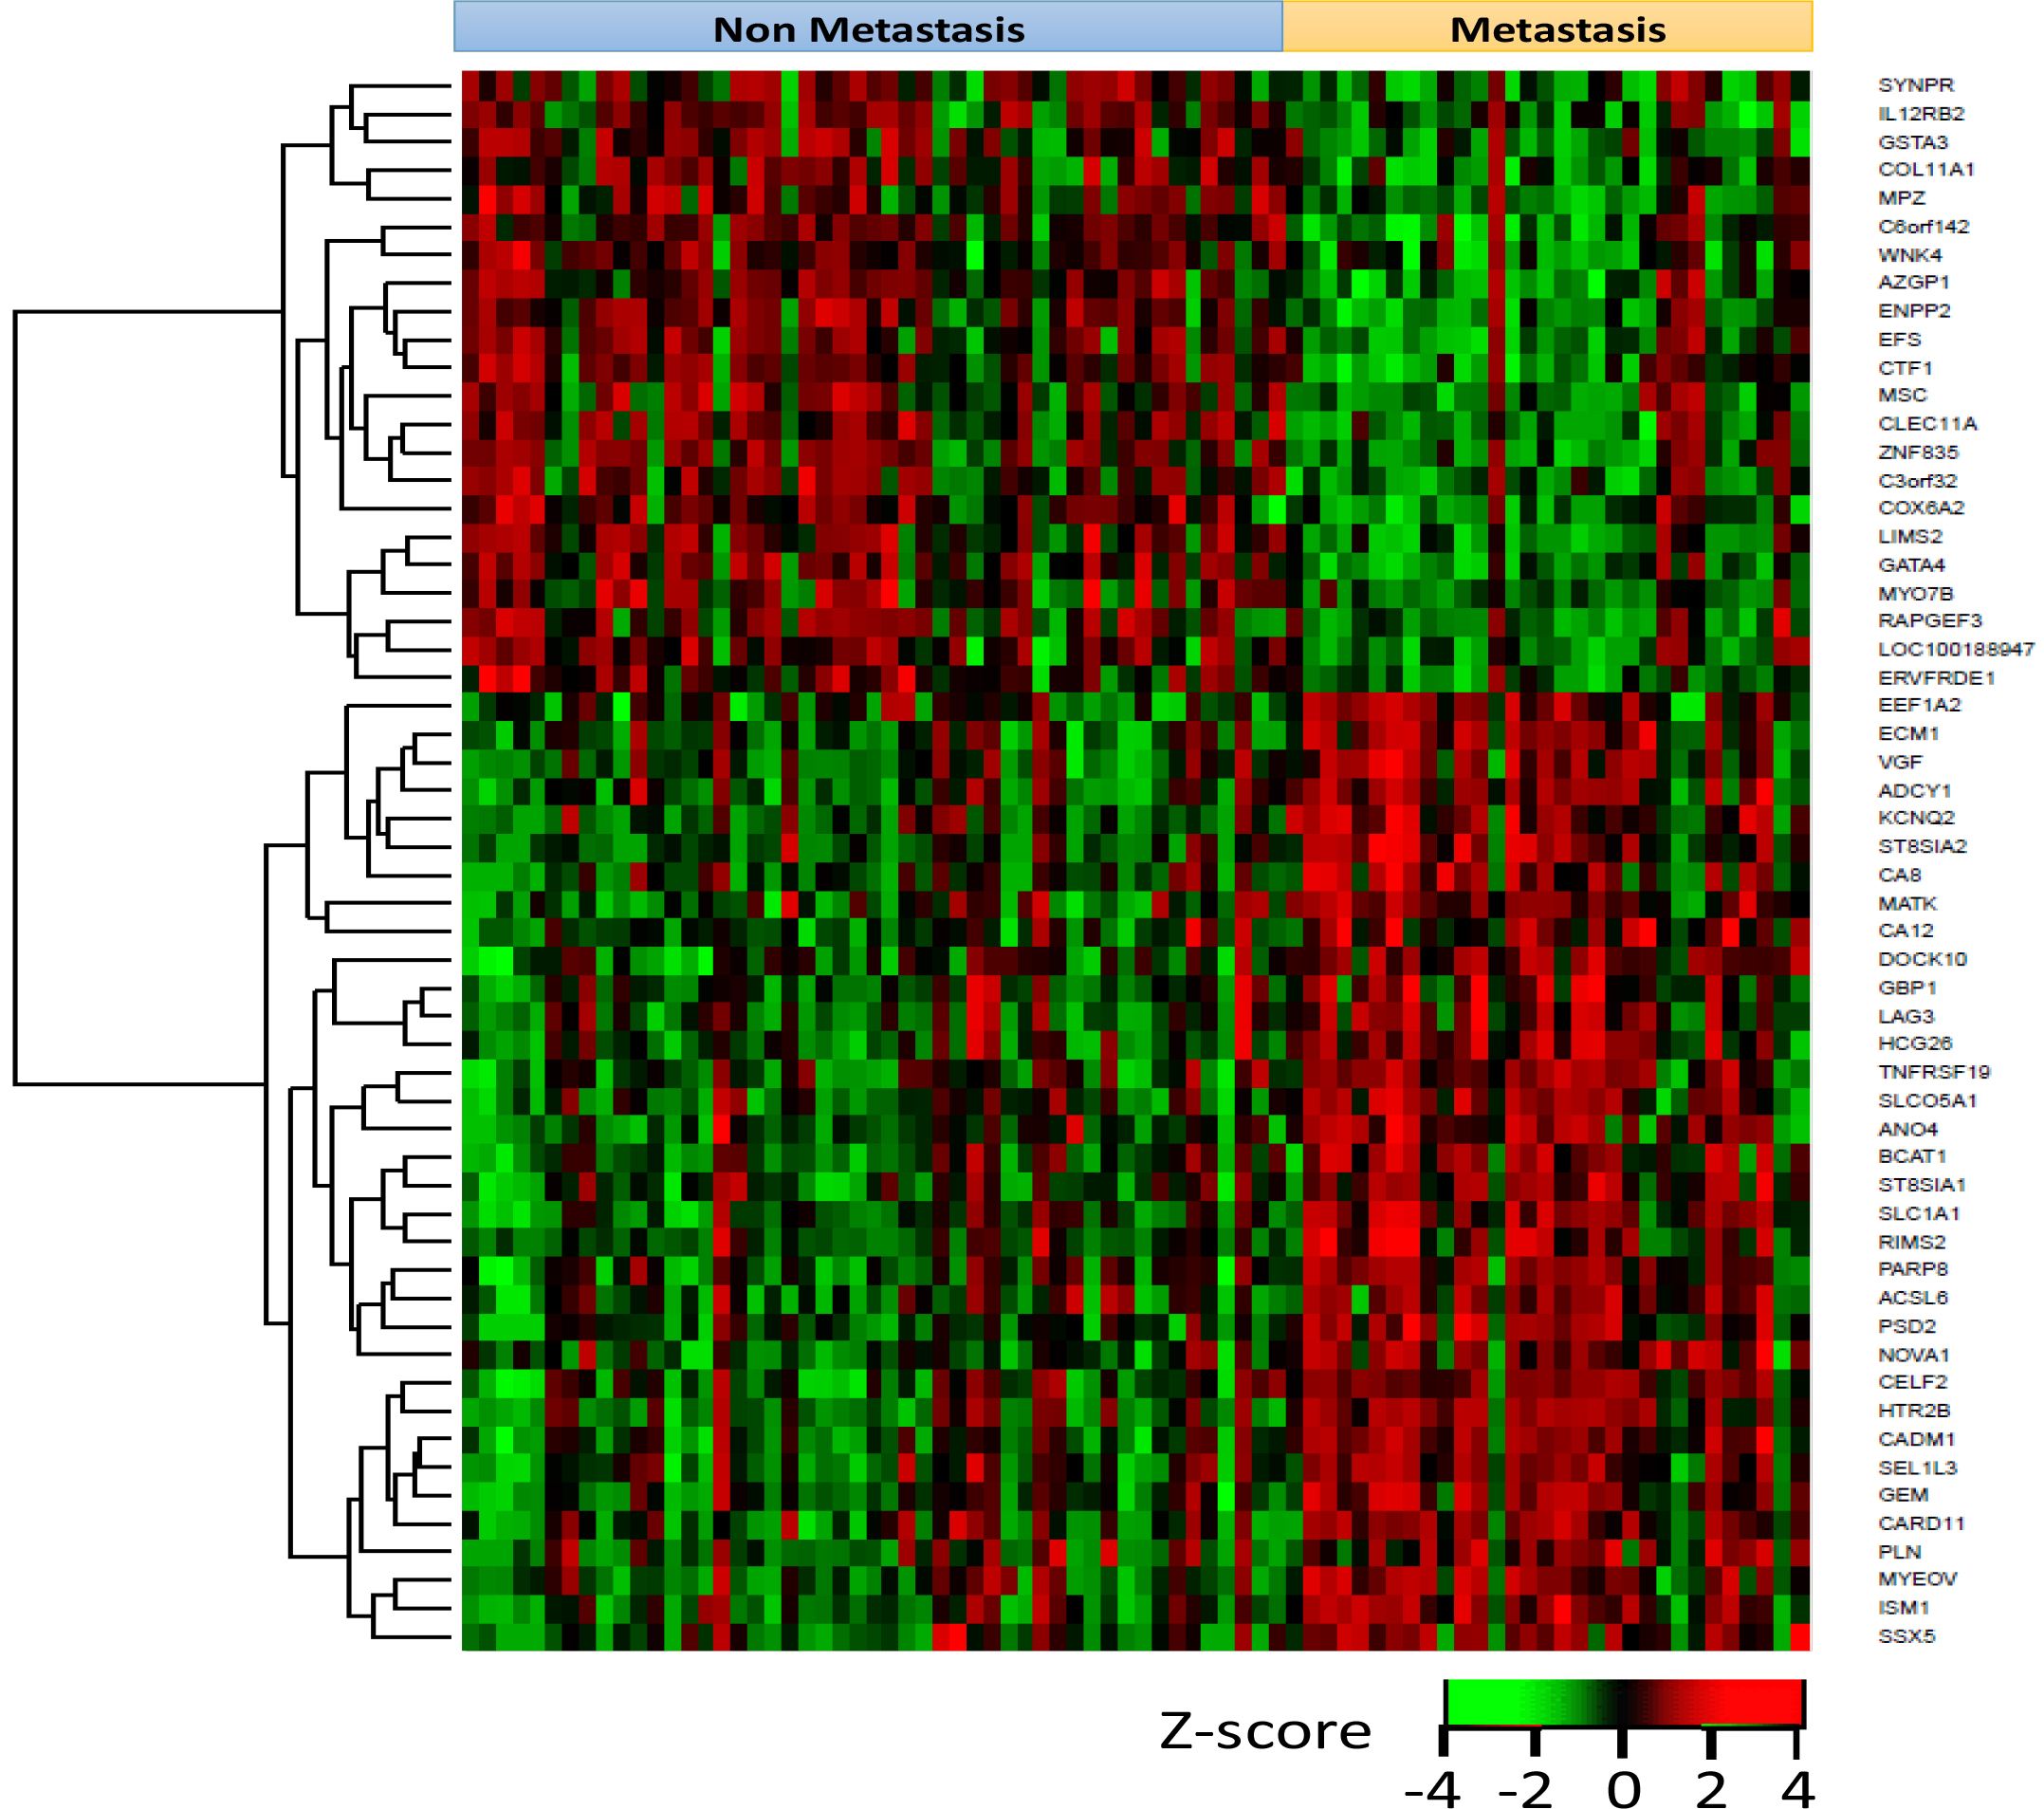
Figure 2: Heatmap representing gene expression values of these 56 genes in all 80 patients. Each row represents a gene and each column represents a patient. Red: high expression. Green: low expression.
The top 20 genes upregulated in UM with metastasis and negatively correlated with patient survival are listed in Table 2. Similarly, the top 20 genes downregulated in metastasis development and positively correlated with patient survival are listed in Table 3. Survival plots for the top 10 genes, whose higher expression is associated with poor patient survival, are shown in Figure 3A. Similarly, the top 10 genes whose lower expression is associated with poor survival are shown in Figure 4A. The box plots visualizing their expression levels in metastasis development groups are shown in Figures 3B (upregulated) and Figure 4B (downregulated).
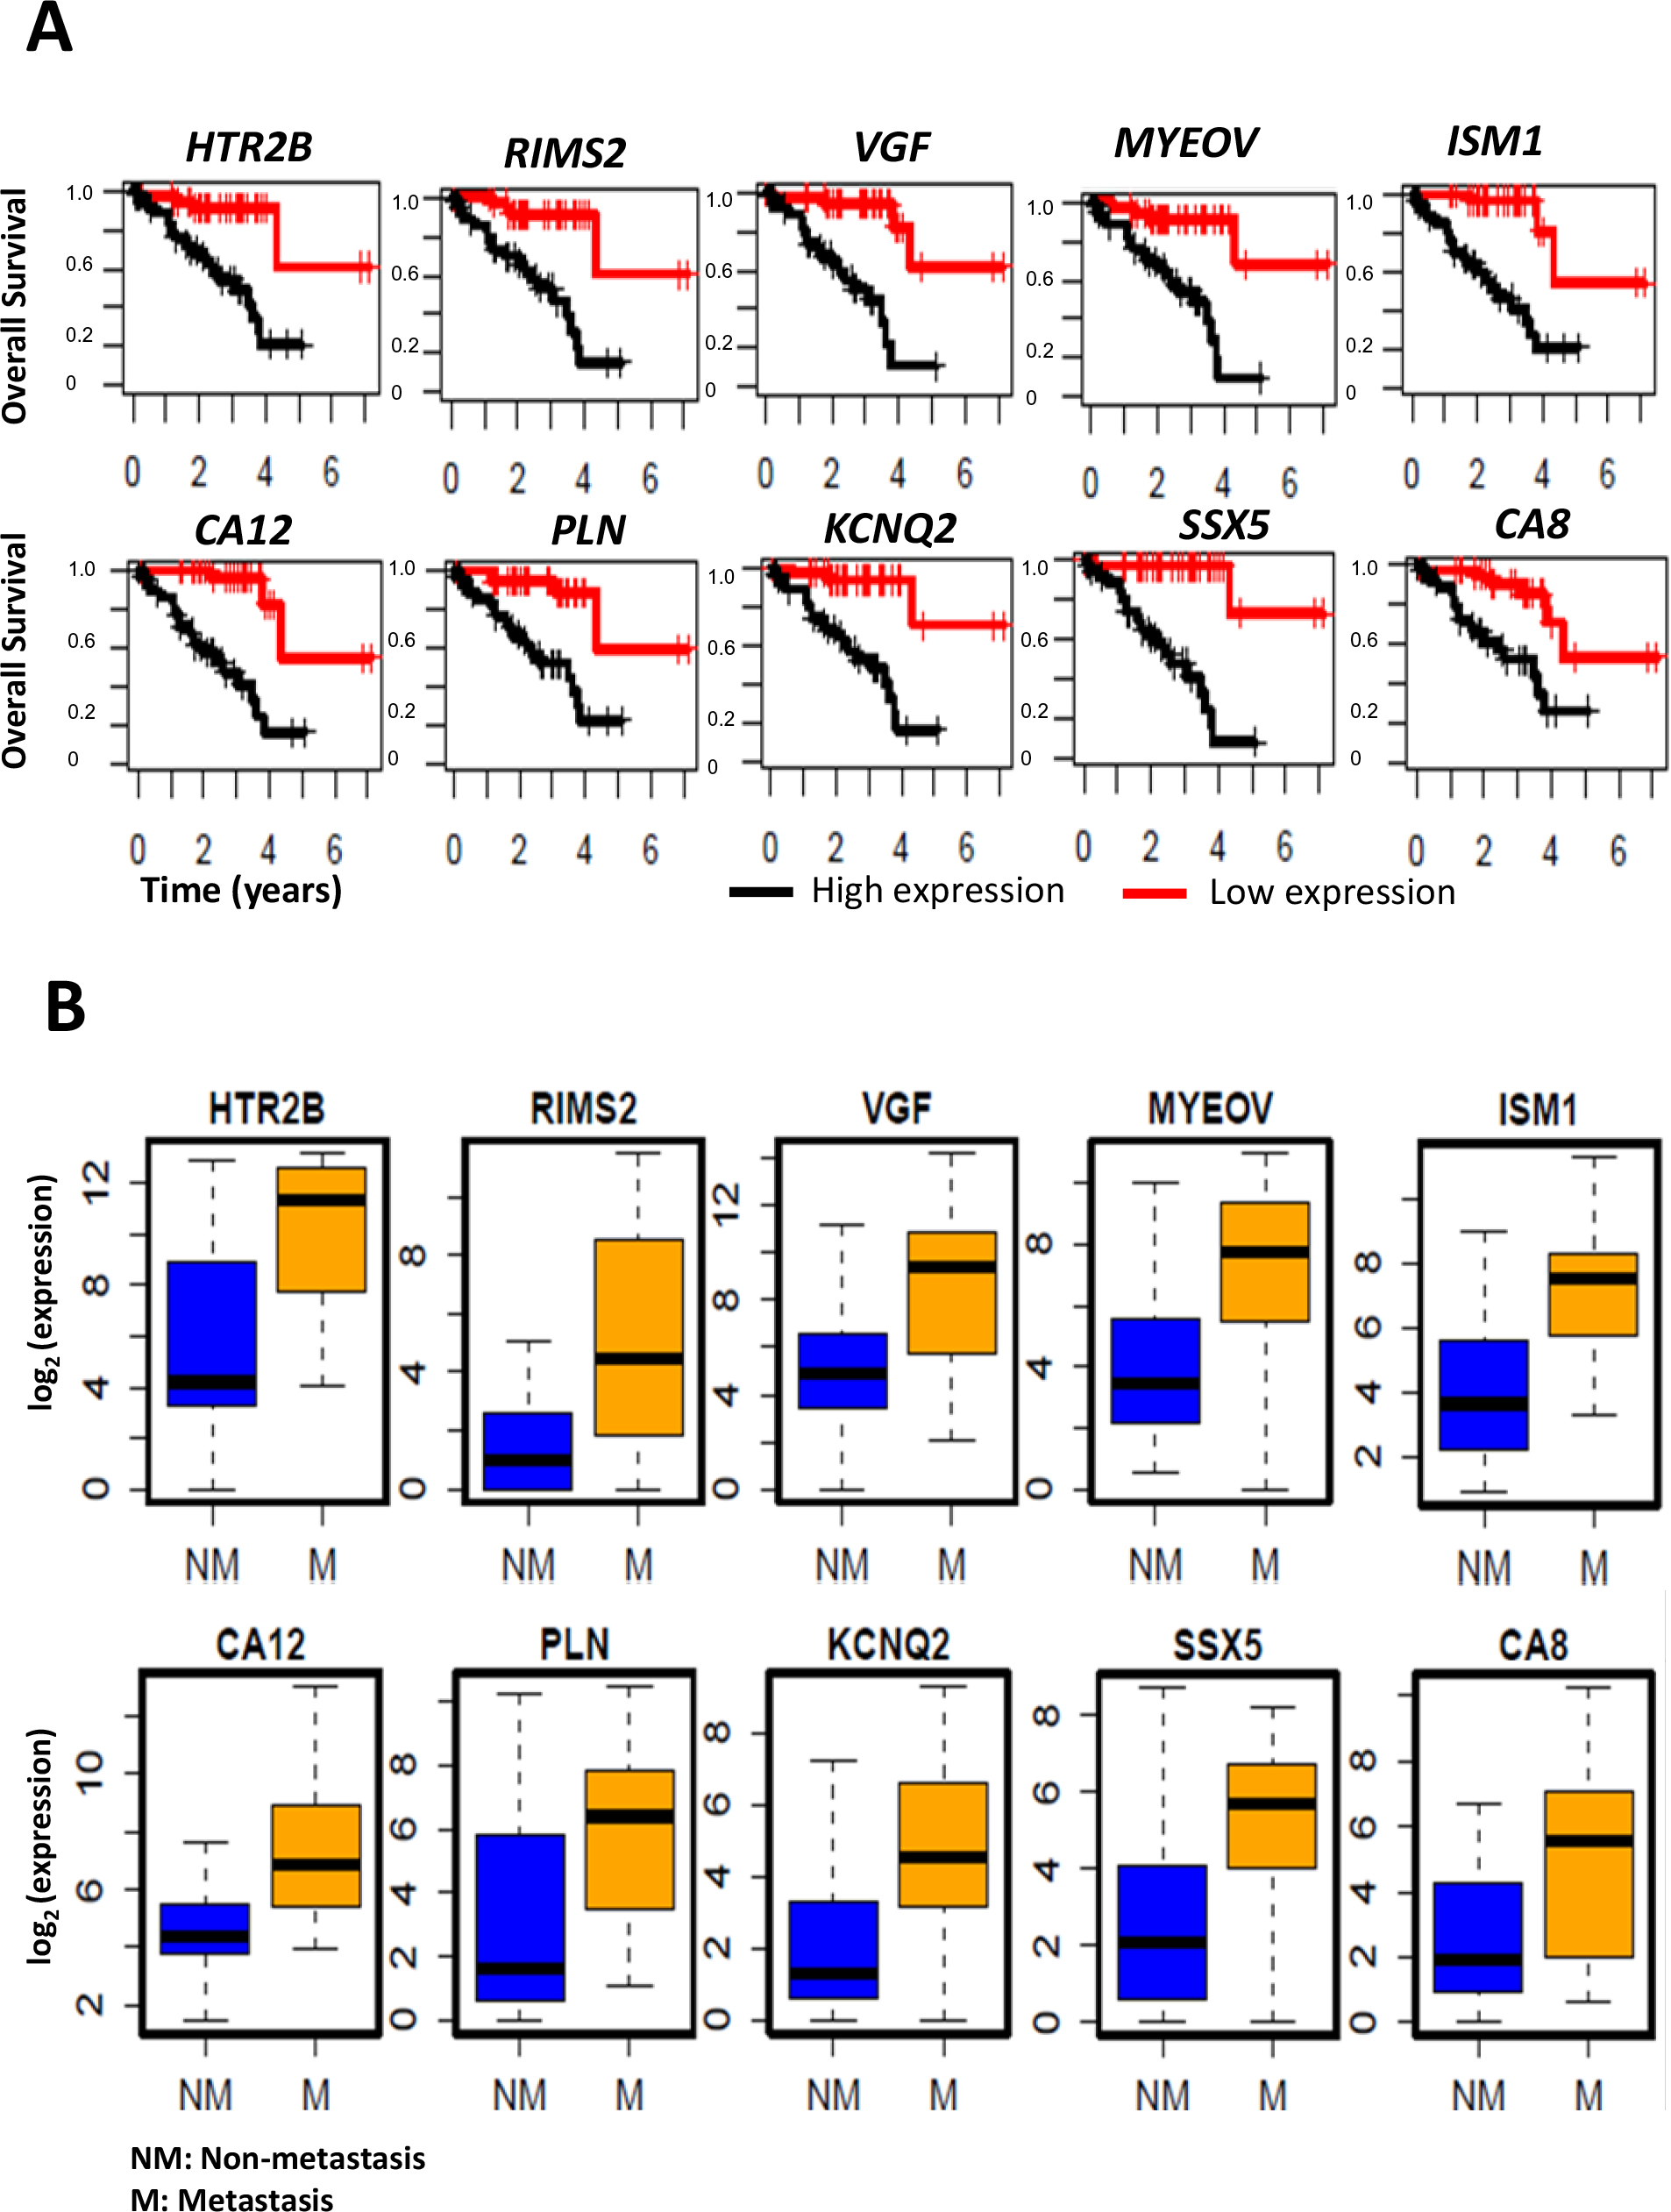
Figure 3: Upregulated genes in UM metastasis.
A: Kaplan-Meier survival curves showing a major difference in overall survival, with respect to high vs. low gene expression levels. B: Boxplots showing the distribution of the gene expression levels in patients with metastasis compared to patients without metastasis.
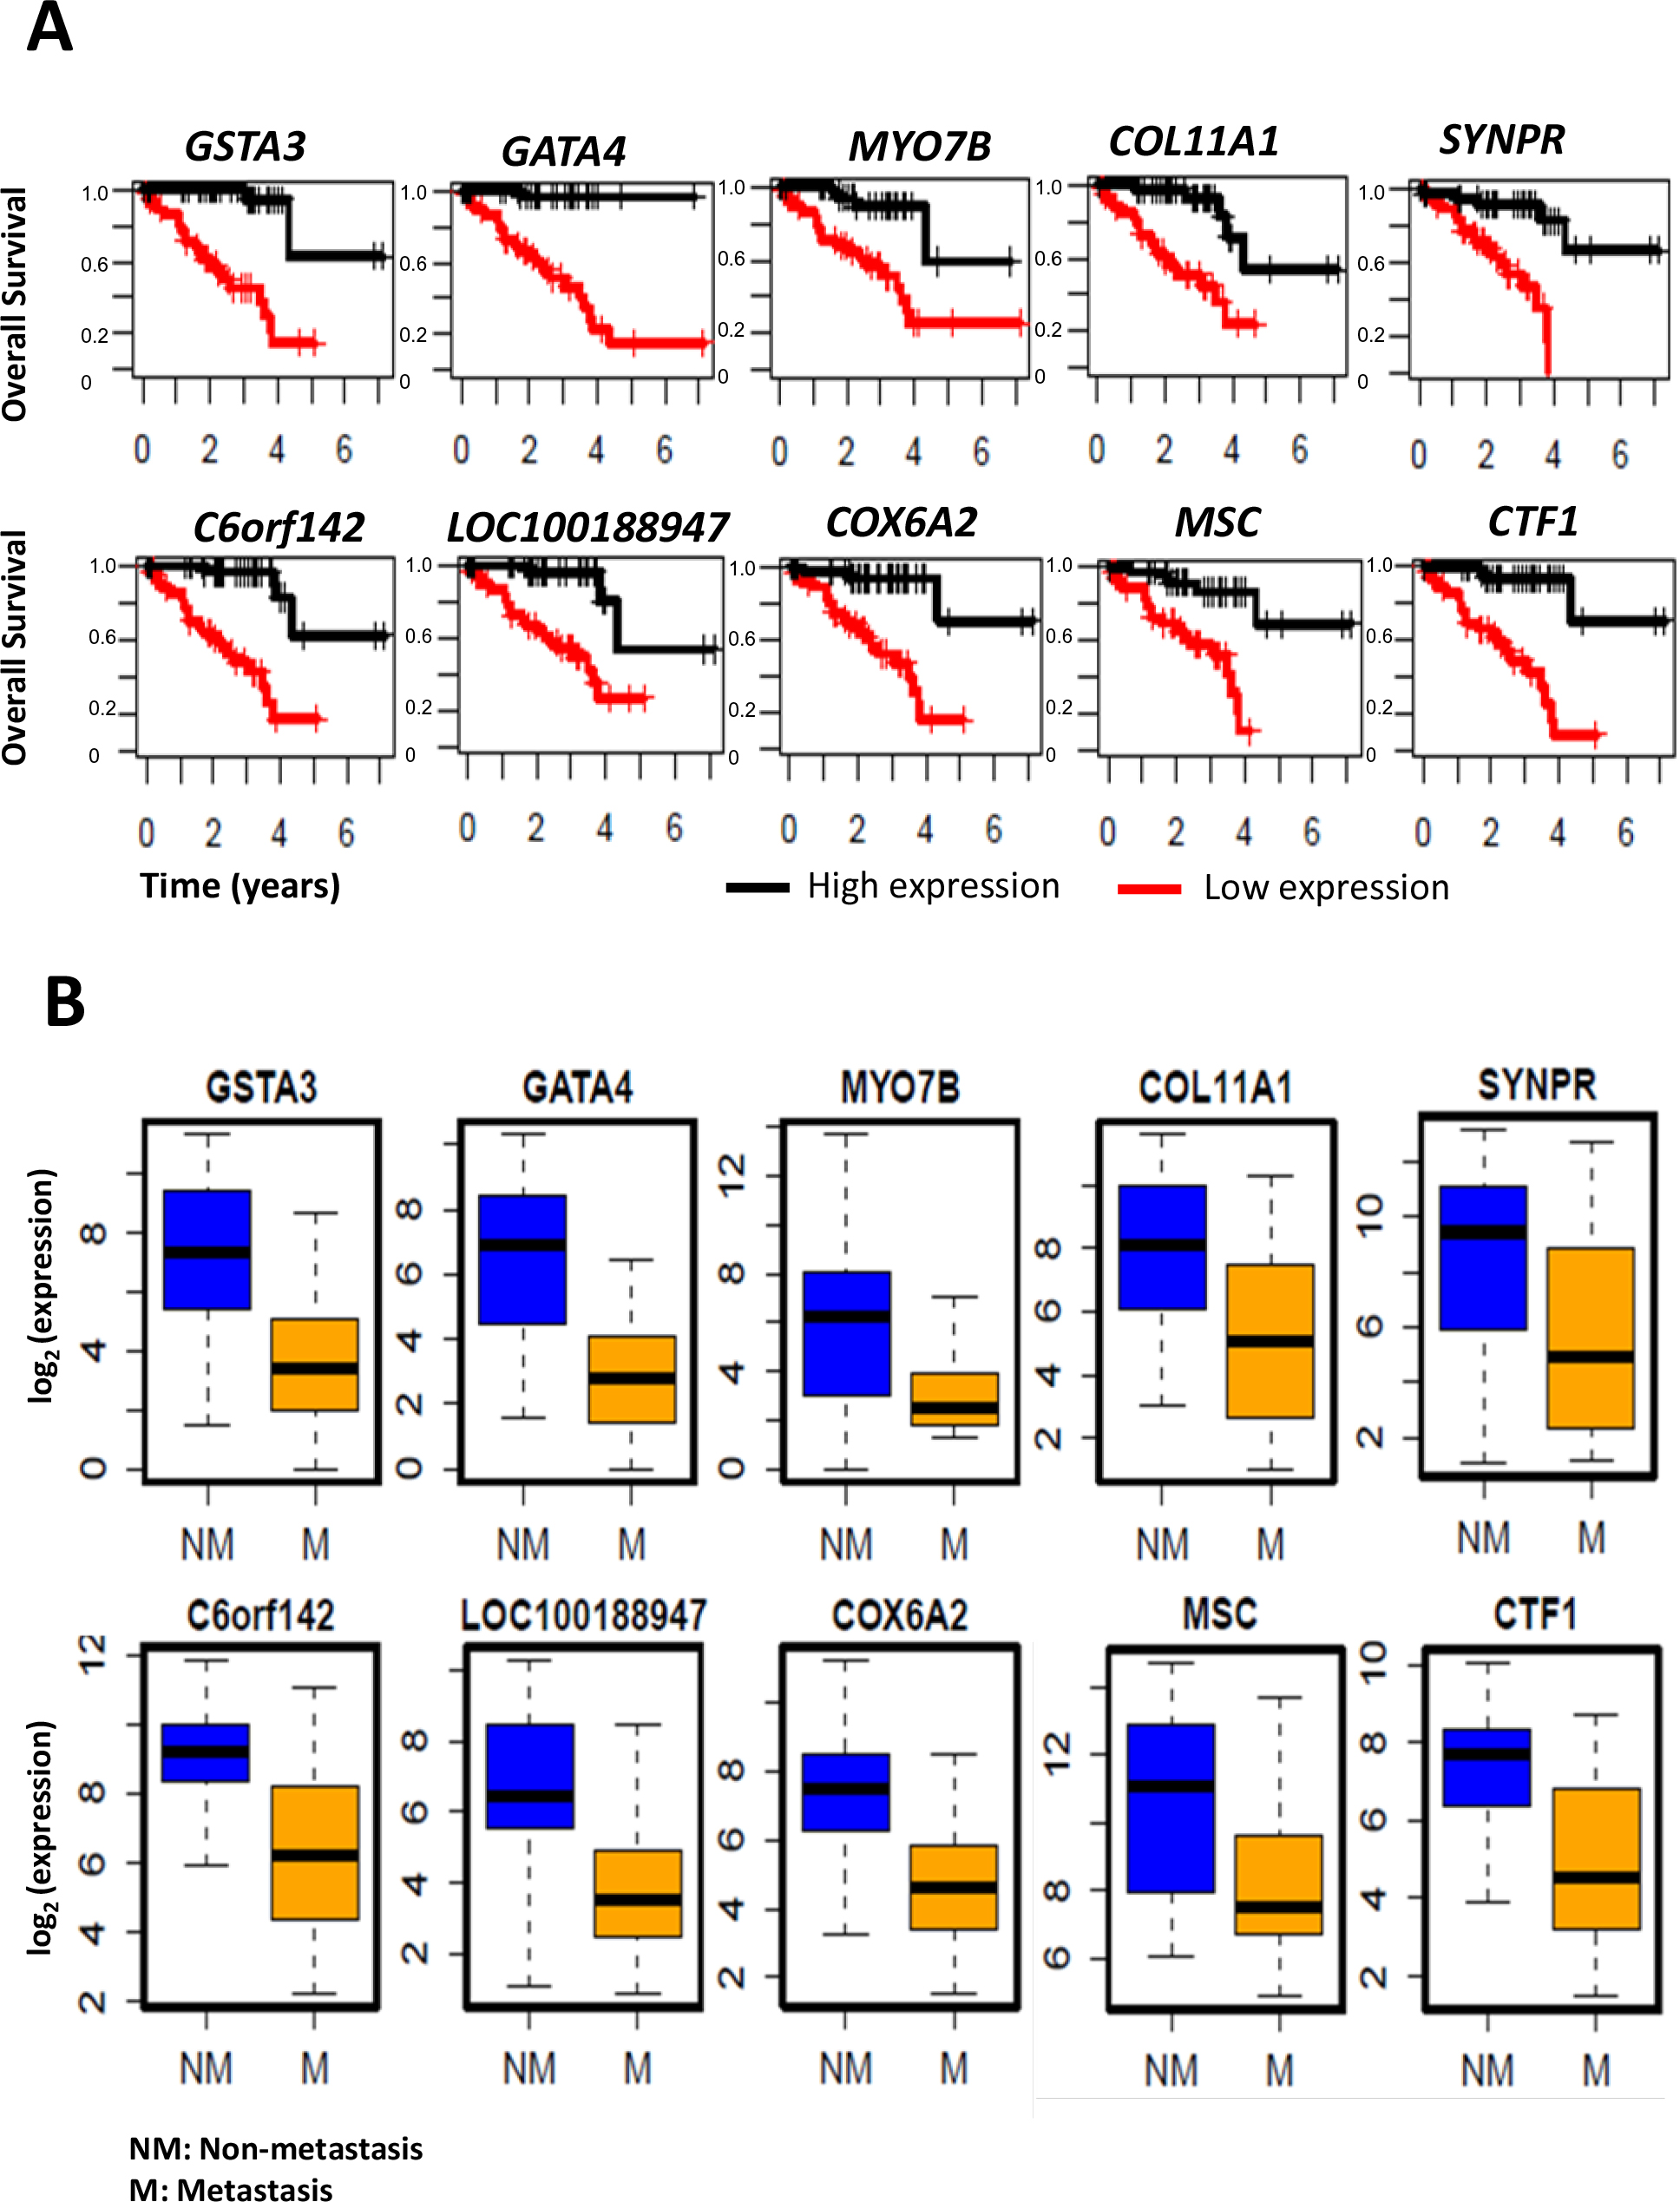
Figure 4: Downregulated genes in UM metastasis.
A: Kaplan-Meier survival curves showing a major difference in overall survival, with respect to high vs. low gene expression levels. B: Boxplots showing the distribution of the gene expression levels in patients with metastasis compared to patients without metastasis.
Bioinformatics Analyses
Gene ontology enrichment analyses were performed using DAVID to gain further insight into the biological functions of the 328 genes associated with UM metastasis and patient survival. The most enriched biological processes include negative regulation of apoptosis (16 genes), negative regulation of cell proliferation (12 genes), and angiogenesis (11 genes). The significantly enriched cellular components include the plasma membrane (90 genes), extracellular space (40 genes), and cell junction (14 genes) (Table 4). The enriched molecular functions include transporter activity (9 genes), lipid binding (7 genes), and antigen binding (6 genes). Overall, gene ontology enrichment analyses revealed six annotation clusters of biological functions highly enriched in the genes associated with UM metastasis. These clusters include membrane protein (132 genes), glycoprotein signaling (100 genes), cell junction (22 genes), and pleckstrin homology domain (10 genes), antigen binding: MHC class-I (5 genes), and cell communication (5 genes) (Table 4).
Table 4: Gene ontology groups enriched in the 328 genes associated with UM metastasis.
|
Gene Ontology Term |
Count |
p-value |
|
Biological Processes |
||
|
Negative regulation of apoptotic process |
16 |
0.004 |
|
Negative regulation of cell proliferation |
12 |
0.040 |
|
Transport |
11 |
0.041 |
|
Chemical synaptic transmission |
11 |
0.003 |
|
Angiogenesis |
11 |
0.002 |
|
Axon guidance |
7 |
0.035 |
|
Regulation of cell migration |
6 |
0.005 |
|
Protein glycosylation |
6 |
0.029 |
|
Cell communication |
5 |
0.002 |
|
Antigen processing and presentation |
5 |
0.009 |
|
Cellular Components |
||
|
Plasma membrane |
90 |
0.001 |
|
Extracellular space |
40 |
0.009 |
|
Cell junction |
14 |
0.019 |
|
Molecular Functions |
||
|
Transporter activity |
9 |
0.012 |
|
Lipid binding |
7 |
0.028 |
|
Antigen binding |
6 |
0.020 |
|
Annotation Clusters |
||
|
Membrane Protein |
132 |
<0.01 |
|
Glycoprotein signaling |
100 |
<0.01 |
|
Cell Junction |
22 |
<0.01 |
|
Protein Recognition domain: Pleckstrin homology domain |
10 |
<0.01 |
|
Antigen Binding: MHC class I |
5 |
<0.01 |
|
Cell communication |
5 |
<0.01 |
Network Analyses
Ingenuity Pathway Analysis (IPA) software was used to discover the interactions between the genes associated with UM metastasis (Figure 5). IPA analyses also revealed that interaction network includes several genes known to be involved epithelial neoplasm, cell movement, migration of cells, development of malignant tumor, invasion of cells, gap junction signaling, endocannabinoid neuronal synapse pathway, CDK5 Signaling, endothelin-1 signaling, GABA receptor signaling, and antigen presentation pathway. The key hub genes of the network are ERBB3 (13 connections), PTGS2 (11 connections), GATA4 (11 connections), GATA6 (9 connections), MYH7 (8 connections), and MYCN (8 connections). The genes in the network are grouped using their cellular compartments including extra cellular space, plasma membrane, cytoplasm, and nucleus.
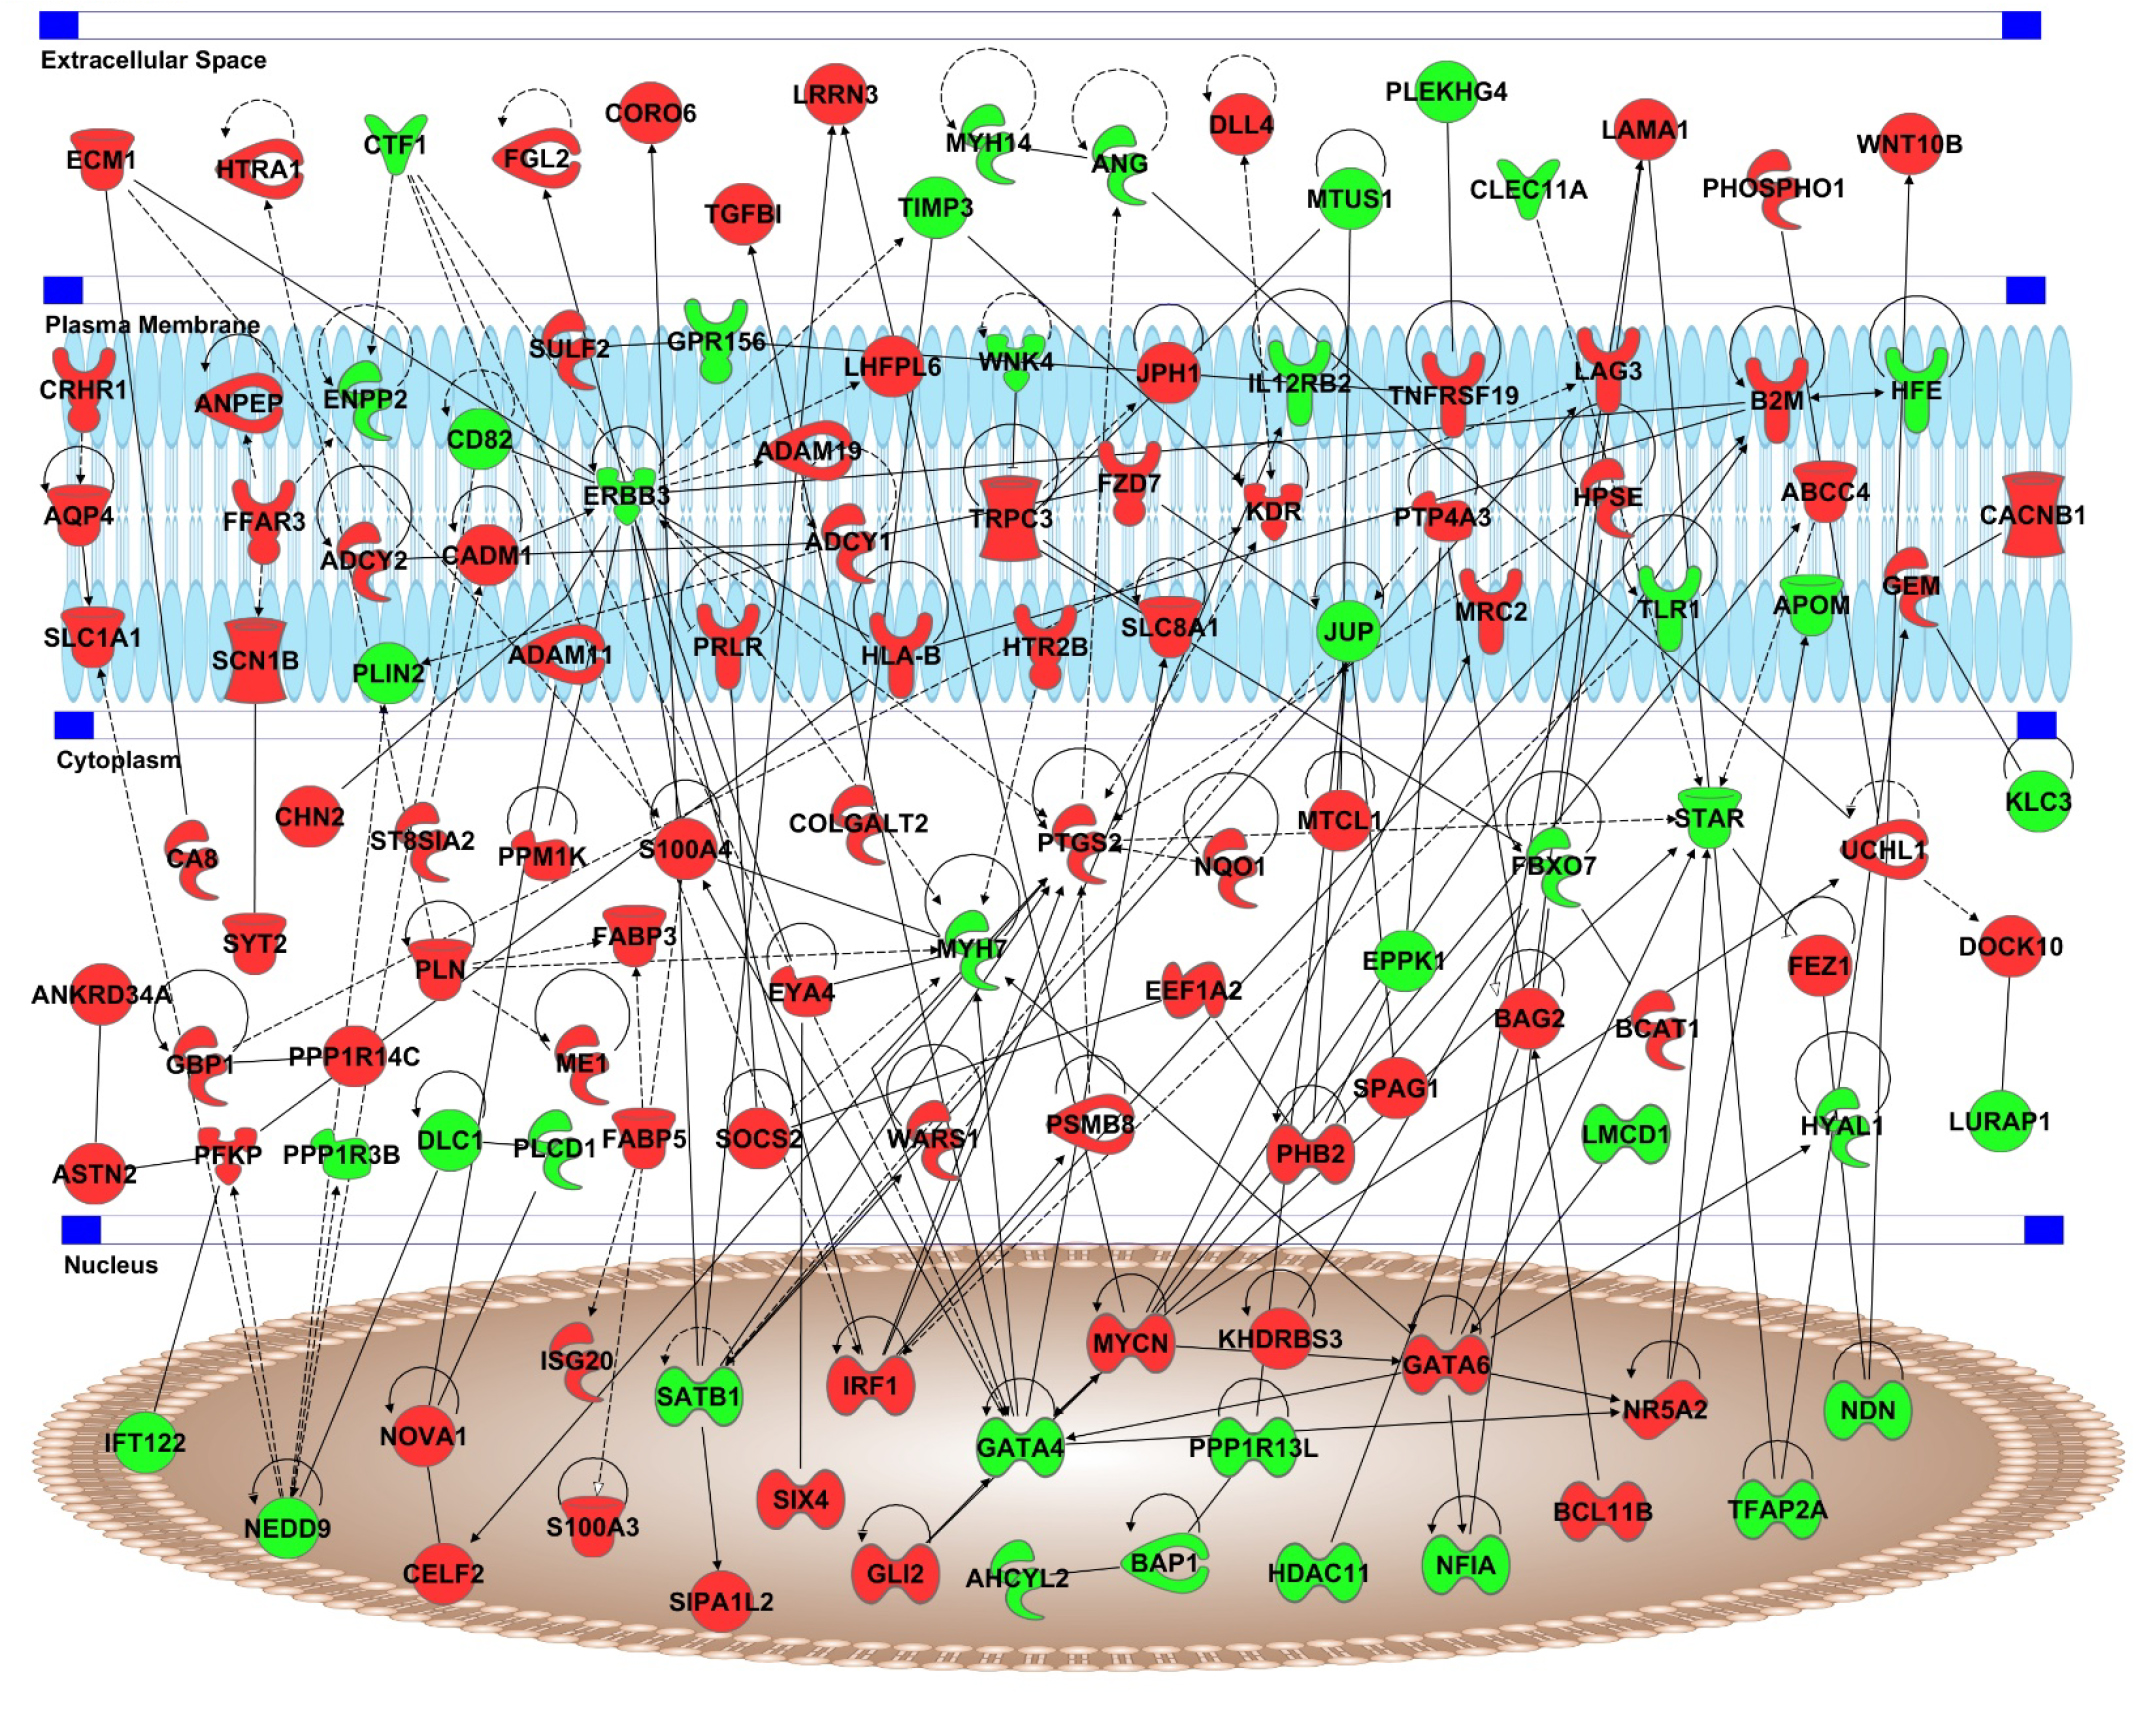
Figure 5: Interaction network of genes in associated with UM metastasis. Red color represent genes upregulated in UM metastasis and green color represents downregulated genes. Genes are separated based on the cellular compartments.
Discussion
The development of metastases plays an important role in UM patient survival. In this study, we identified gene expression signatures associated with metastasis and poor survival in UM patients. Identification of molecular characteristics associated with UM metastasis has the potential to elucidate precise molecular mechanisms, accurately classify high-risk patients, and to provide novel potential therapeutic targets.
Out of the top 20 genes found to be upregulated in metastatic UM, 12 genes including HTR2B, RIMS2, VGF, MYEOV, ISM1, CA12, PLN, SSX5, SLCO5A1, SLC1A1, CADM1, and TNFRSF19, have been previously reported to be associated with aggressive UM. HTR2B gene, which encodes for the Serotonin receptor 5-hydroxytrytamine receptor-2B, was the most upregulated gene (~24-fold) in metastatic patients, and its increased expression was also associated with poor survival. This gene is well-known to be elevated in cases of metastatic UM and is one of the genes used in the DecisionDx-UM prognostic test [36–38]. RIMS2 encodes for regulating synaptic membrane exocytosis-2 protein involved in neuronal synaptic transmission and neurotransmitter release; mutations in RIMS2 have been linked to inherited retinal disease. RIMS2 and phospholamban (PLN) are known to be overexpressed in monosomy 3 UM [39, 40]. Phospholamban is an important regulator of cardiac muscle contractility, and its role in UM remains unclear [41]. Isthmin-1 (ISM1) is a known inhibitor of angiogenesis [42]. Interestingly, isthmin-1 expression is regulated by long non-coding RNA (lncRNA) H19, a well-known lncRNA associated with invasion and metastasis in several cancer types [43, 44]. Carbonic anhydrase 12 (CA12), is highly expressed in many cancers and is thought to contribute to the acidification of the tumor microenvironment [45]. Solute carrier transporter family members SLCO5A1 and SLC1A1 are expressed by several cell types within the retina. Although these transporters are known to be overexpressed in several cancers, their role in UM has not been fully characterized [46–48]. The protein product of the VGF gene is a neuroprotective growth factor and has been previously identified in a proteomic profiling study of UM as being highly upregulated in high-risk UM [49, 50]. Myeloma overexpressed gene (MYEOV) is known to be overexpressed in UM and several other cancer types [51]. In non-small cell lung cancer, this gene has been shown to increase metastasis through the amplification of TGF-β signaling, but its function in UM has not been established [51, 52]. The transcriptional repressor synovial sarcoma X breakpoint protein 5 (SSX5) is known to be upregulated in UM, and expression of the SSX family of proteins is correlated with a more aggressive tumor phenotype in vitro [53]. Both CADM1 (cell adhesion molecule 1) and TNFRSF19 are known to be upregulated in monosomy 3 UM [39]. TNFRSF19 is a member of the tumor necrosis factor receptor superfamily known to be regulated by beta-catenin. It has been shown to activate NF-kB, and its increased expression is linked with cell migration and invasion [54, 55].
There were 8 other genes newly identified as highly upregulated in metastatic UM. These included the following: KCNQ2, CA8, ST8SIA2, DOCK10, MATK, PSD2, EEF1A2, and CARD11. KCNQ2 encodes for a voltage-gated potassium channel, and mutations in this gene are known to cause inherited neonatal epilepsy [56]. In highly metastatic breast cancer, increased expression of KCNQ2 has been reported in conjunction with decreased expression of Na-K ATPase and may be responsible for increased potassium flux and an alternative mechanism for intracellular ion homeostasis [57]. Carbonic anhydrase-related protein-8 (CA8) is a carbonic anhydrase isoform that lacks conventional enzymatic activity. This protein has high inter-species conservation and yet its exact function remains unclear. Even so overexpression of this protein has been reported in lung and colorectal cancers [58, 59]. ST8SIA2 encodes alpha-2,8-sialyltransferase 8B. Important in this regard is a well-known altered sialic acid processing with secondary to hyper-sialylation of surface glycans [60]. Altered expression of the ST8SIA2 gene has also been reported in lung and gastric cancers, where its function remains unclear [61, 62]. DOCK10 is a guanine nucleotide exchange factor (GEF) for Rho GTPases, and its activity is linked to amoeboid invasion and increased metastasis in cutaneous melanoma, breast cancer, and cervical cancer [63–65]. Megakaryocyte-associated tyrosine-protein kinase (MATK) is known to be mutated in a small percentage of cutaneous melanoma tumors [66]. The PSD2 enzyme (phosphatidylethanolamine) has been shown to be elevated in the serum of patients with metastatic lung cancer [67, 68]. Caspase recruitment domain family member 11 (CARD11) is also known to alter NF-kB activity, and while mutations in this gene have been identified in primary vitreoretinal lymphoma, its role in UM has not been evaluated [69]. EEF1A2 has been identified as an oncogene in breast and ovarian cancers that encodes for elongation factor eEF-1α2 protein, and to our knowledge, its role in UM has not been previously reported [70–72].
Among the top downregulated genes, the enzyme GST alpha 3 (GSTA3) plays an important role in steroid biosynthesis, and the downregulation of GSTA3 has been previously reported in metastatic UM [73]. Both collagen type XI alpha I (COL11A1) and synaptoporin (SYNPR) are previously shown to be significantly downregulated in monosomy 3 UM [47]. SYNPR is an isoform of the major synaptic protein synaptophysin, and its function in cancer remains unclear [74–76]. COX6A2, a subunit of Complex IV in the electron transport chain, has been reported to be downregulated in monosomy 3 UM [77–79]. MSC is the gene encoding the transcriptional repressor musculin, and in gastric cancer, methylation of the MSC promotor is associated with more aggressive tumors [80]. Cardiotrophin-1 (CTF1) is a member of the interleukin-6 family of cytokines known to activate STAT3 signaling [81]. Embryonal Fyn-associated substrate (EFS) plays a role in the Src signaling pathway, and hypermethylation of this gene has been shown to be associated with poor prognosis in UM [82, 83]. ENPP2 (the autotaxin enzyme) is involved in the synthesis of lysophosphatidic acid and is thought to play a role in cancer metastasis and cancer stem cell function [84]. AZGP1 encodes zinc-α2-glycoprotein, a tumor suppressor that inhibits TGF-β, and this gene is known to be downregulated in high-risk UM [85, 86]. IL12RB2 is a subunit of the IL-12 receptor, and while the IL-12 cytokine is known to be differentially expressed in metastatic UM, altered expression of the IL12RB2 receptor has not been previously reported [87]. Decreased expression of LIMS2 gene is thought to play a role in tumor metastasis [88]. MPZ encodes myelin protein zero, the most abundant protein in myelin, and while mutations and aberrant expression of this gene are implicated in many neuropathic diseases, its role in cancer is not clear [89].
Pathway analyses revealed that differentially expressed genes are enriched in many well-known cancer processes such as cell proliferation, migration, apoptosis, and angiogenesis. Interestingly, chemical synaptic transmission was a top ontology term for the genes identified, and three of the top differentially expressed genes – HTR2B, RIMS2, and SYNPR – have known synaptic functions. While it has been reported that breast cancer metastases to the brain can develop neuronal-like characteristics, little is known about the role of synaptic proteins in UM metastasis [90].
Interaction network of genes revealed the top players with dense connections to several other genes in the pathway. ERBB3 is known to be activated by neuregulin-1 and hepatocyte growth factor which provide drug resistance in metastatic UM [91]. Furthermore, ERBB3 signaling is shown to be involved in the survival of melanoma cells after metastasis [92]. This is consistent with its role in tumor development and progression along with other members of the epidermal growth factor receptor family [93]. PTGS2 is commonly expressed in malignant melanomas and is associated with poor patient survival [94]. In Uveal Melanoma, the expression of Cox-2, a prostaglandin synthase was related to poor prognostic markers including the presence of lymphocytic infiltration, vascular closed loops and the presence of epithelioid cell type in tumors [95]. Network analysis also revealed a total of 20 proteins connected to GATA4 and GATA6, a family of zinc finger proteins. While their role in Uveal Melanoma is yet to be established, GATA3 is known to interact with hypoxia inducible factor and known to promote the invasiveness of head and neck squamous cell carcinoma [96]. MYH7B encodes a heavy chain of myosin II and genome wide association studies have shown that loci containing MYH7B gene (20q11.22) is associated with an increased susceptibility to cutaneous melanoma [97].
Conclusion
In conclusion, our analyses confirmed several previously reported genes associated with high-risk UM. We also identified many novel genes that had not been associated with metastatic UM including KCNQ2, CA8, ST8SIA2, DOCK10, MATK, PSD2, EEF1A2, CARD11, GATA4, MYO7B, C6orf142, LOC100188947, MSC, CTF1, C3orf32, IL12RB2, LIMS2, ZNF835, ERVFRDE1, and CLEC11A. The majority of these genes have known significance in other cancer types, and several have well-known functions related to cancer cell invasiveness and metastasis. This study provides candidates for expanding our understanding of the biology of metastatic UM.
Author Contributions
Conceptualization, AS, LU, KB, SS; Formal analysis, TJL, AV and SK; Methodology, TJL and SK; Project administration, AS; Resources, LU, KB and SS; Supervision, AS; Writing – original draft, TJL, RR and SK; Writing – review & editing, LU, KB, SS and AS.
References
- Singh AD, ME Turell and AK Topham (2011) Uveal melanoma: trends in incidence, treatment, and survival. Opthalmology 118: 1881–1885. [View]
- Aronow ME, AK. Topham and AD Singh (2018) Uveal Melanoma: 5-Year Update on Incidence, Treatment, and Survival (SEER 1973–2013). Ocular oncology pathology 4: 145–151. [View]
- Carvajal RD et al., (2017) Metastatic disease from uveal melanoma: treatment options and future prospects. Br J Ophthalmol 101: 38–44. [View]
- Diener-West M et al., (2005) Development of metastatic disease after enrollment in the COMS trials for treatment of choroidal melanoma: Collaborative Ocular Melanoma Study Group Report No. 26. Arch Ophthalmol 123: 1639–43. [View]
- Ramaiya KJ and JW Harbour (2007) Current management of uveal melanoma. Expert Review of Ophthalmology 2: 939–946. [View]
- Yang J et al., (2018) Treatment of uveal melanoma: where are we now? Therapeutic advances in medical oncology 10: 1758834018757175. [View]
- Collaborative Ocular Melanoma Study, G., (2006) The COMS randomized trial of iodine 125 brachytherapy for choroidal melanoma: V. Twelve-year mortality rates and prognostic factors: COMS report No. 28. Arch Ophthalmol 124: 1684–93. [View]
- Augsburger JJ, ZM Correa and AH Shaikh (2009) Effectiveness of treatments for metastatic uveal melanoma. Am J Ophthalmol 148: 119–27. [View]
- Kuk D, et al., (2016) Prognosis of Mucosal, Uveal, Acral, Nonacral Cutaneous, and Unknown Primary Melanoma From the Time of First Metastasis. Oncologist 21: 848–54. [View]
- Buder K., et al., (2013) Systemic treatment of metastatic uveal melanoma: review of literature and future perspectives. Cancer medicine 2: 674–686. [View]
- Augsburger J.J , ZM Corrêa and A.H. Shaikh (2009) Effectiveness of treatments for metastatic uveal melanoma. American journal of ophthalmology 148: 119–127. [View]
- Diener-West M., et al., (2005) Development of metastatic disease after enrollment in the COMS trials for treatment of choroidal melanoma: Collaborative Ocular Melanoma Study Group Report No. 26. Archives of ophthalmology 123: 1639–1643. [View]
- Triozzi PL and AD Singh (2014) Adjuvant Therapy of Uveal Melanoma: Current Status. Ocul Oncol Pathol 1: 54–62. [View]
- Abdel-RahmanMH., et al., (2011) Melanoma candidate genes CDKN2A/p16/INK4A, p14ARF, and CDK4 sequencing in patients with uveal melanoma with relative high-risk for hereditary cancer predisposition. Melanoma Res 21: 175–9. [View]
- Robertson AG et al., (2017) Integrative Analysis Identifies Four Molecular and Clinical Subsets in Uveal Melanoma. Cancer Cell 32: 204–220 e15. [View]
- Horsman DE et al., (1990) Monosomy 3 and isochromosome 8q in a uveal melanoma. Cancer Genet Cytogenet 45: 249–53. [View]
- Prescher G, N. Bornfeld and R. Becher (1990) Nonrandom chromosomal abnormalities in primary uveal melanoma. J Natl Cancer Inst 82: 1765–9. [View]
- Damato B et al.,(2007) Cytogenetics of uveal melanoma: a 7-year clinical experience. Ophthalmology 114: 1925–31. [View]
- Harbour JW et al., (2010) Frequent mutation of BAP1 in metastasizing uveal melanomas. Science 330: 1410–3. [View]
- Lake SL et al., (2013) Single nucleotide polymorphism array analysis of uveal melanomas reveals that amplification of CNKSR3 is correlated with improved patient survival. Am J Pathol 182: 678–87. [View]
- Amaro A et al., (2017) The biology of uveal melanoma. Cancer Metastasis Rev. 36: 109–140. [View]
- Tschentscher F et al., (2003) Tumor classification based on gene expression profiling shows that uveal melanomas with and without monosomy 3 represent two distinct entities. Cancer Res 63: 2578–84. [View]
- Onken MD et al., (2004) Gene expression profiling in uveal melanoma reveals two molecular classes and predicts metastatic death. Cancer Res 64: 7205–9. [View]
- van Gils W et al.,(2008) Gene expression profiling in uveal melanoma: two regions on 3p related to prognosis. Invest Ophthalmol Vis Sci 49: 4254–62. [View]
- Laurent C et al.,(2011) High PTP4A3 phosphatase expression correlates with metastatic risk in uveal melanoma patients. Cancer 71: 666–74. [View]
- Amaro A et al.,(2016) Analysis of the Expression and Single-Nucleotide Variant Frequencies of the Butyrophilin-like 2 Gene in Patients With Uveal Melanoma. JAMA Ophthalmol 134: 1125–1133. [View]
- KarlssonJ et al., (2020) Molecular profiling of driver events in metastatic uveal melanoma. Nat Commun 11: 1894. [View]
- KimYJ et al., (2019) Multi-Platform Omics Analysis for Identification of Molecular Characteristics and Therapeutic Targets of Uveal Melanoma. Sci Rep 9: 19235. [View]
- Li YZ et al., (2020) Identification of an immune-related signature for the prognosis of uveal melanoma. Int J Ophthalmol 13: 458–465. [View]
- Smit KN et al., (2019) Aberrant MicroRNA Expression and Its Implications for Uveal Melanoma Metastasis. Cancers (Basel) 11. [View]
- Zhang Y et al., (2014) Expression analysis of genes and pathways associated with liver metastases of the uveal melanoma. BMC Med Genet 15: 29. [View]
- Singh AD, ME Turell and AK Topham (2011) Uveal melanoma: trends in incidence, treatment, and survival. Ophthalmology 118: 1881–5. [View]
- RitchieME et al., (2015) limma powers differential expression analyses for RNA-sequencing and microarray studies. Nucleic Acids Res. 43: e47. [View]
- Huang da W, BT Sherman and RA Lempicki (2009) Systematic and integrative analysis of large gene lists using DAVID bioinformatics resources. Nat Protoc 4: 44–57. [View]
- Huang da W, BT Sherman and RA Lempicki (2009) Bioinformatics enrichment tools: paths toward the comprehensive functional analysis of large gene lists. Nucleic Acids Res 37: 1–13. [View]
- Harbour JW and RChen (2013) The DecisionDx-UM gene expression profile test provides risk stratification and individualized patient care in uveal melanoma. PLoS currents. 5. [View]
- Le-Bel G et al., (2019) Analysis of the proteasome activity and the turnover of the serotonin receptor 2B (HTR2B) in human uveal melanoma. Experimental Eye Research 184: 72–77. [View]
- Weidmann C et al., (2018) Expression of the serotonin receptor 2B in uveal melanoma and effects of an antagonist on cell lines. Clinical experimental metastasis. 35: 123–134. [View]
- Burgess BL et al., (2011) Characterization of three cell lines derived from fine needle biopsy of choroidal melanoma with metastatic outcome. Molecular vision 17: 607. [View]
- Huang X-F et al., (2017) Genome-wide detection of copy number variations in unsolved inherited retinal disease. Investigative ophthalmology visual science 58: 424–429. [View]
- MacLennan DH, EG Kranias (2003) Calcium: Phospholamban: A crucial regulator of cardiac contractility. Nature reviews Molecular cell biology 4: 566. [View]
- Xiang W et al., (2011) Isthmin is a novel secreted angiogenesis inhibitor that inhibits tumour growth in mice. Journal of cellular molecular medicine. 15: 359–374. [View]
- Li H et al., (2014) Overexpression of lncRNA H19 enhances carcinogenesis and metastasis of gastric cancer. Oncotarget. 5: 2318. [View]
- LiJ et al., (2016) Regulation of lncRNA and its role in cancer metastasis. Oncology Research Featuring Preclinical Clinical Cancer Therapeutics 23: 205–217. [View]
- Ivanov S et al., (2001)Expression of hypoxia-inducible cell-surface transmembrane carbonic anhydrases in human cancer. The American journal of pathology 158: 905–919. [View]
- Sebastian K et al., (2013) Characterization of SLCO5A1/OATP5A1, a solute carrier transport protein with non-classical function. PloS one 8: e83257. [View]
- McCannelTA et al., (2010) Identification of candidate tumor oncogenes by integrative molecular analysis of choroidal melanoma fine-needle aspiration biopsy specimens. Archives of ophthalmology 128: 1170–1177. [View]
- Kugler P and A Beyer (2003) Expression of glutamate transporters in human and rat retina and rat optic nerve. Histochemistry cell biology 120: 199–212. [View]
- Takeuchi H et al., (2018) VGF nerve growth factor inducible is involved in retinal ganglion cells death induced by optic nerve crush. Scientific reports 8: 16443. [View]
- Angi M et al., (2016) In-depth proteomic profiling of the uveal melanoma secretome. Oncotarget 7: 49623. [View]
- FangL et al., (2019) MYEOV functions as an amplified competing endogenous RNA in promoting metastasis by activating TGF-β pathway in NSCLC. Oncogene 38: 896. [View]
- Fagone P et al., (2017) Identification of novel chemotherapeutic strategies for metastatic uveal melanoma. Scientific reports 7: 44564. [View]
- Ness C et al., (2017) Multicellular tumor spheroids of human uveal melanoma induce genes associated with anoikis resistance, lipogenesis, and SSXs. Molecular vision. 23: 680. [View]
- Schön S et al., (2014) β?catenin regulates NF?κB activity via TNFRSF19 in colorectal cancer cells. International journal of cancer 135: 1800–1811. [View]
- Paulino VM et al., (2010) TROY (TNFRSF19) is overexpressed in advanced glial tumors and promotes glioblastoma cell invasion via Pyk2-Rac1 signaling. Molecular cancer research 8: 1558–1567. [View]
- Singh NA et al., (1998) A novel potassium channel gene, KCNQ2, is mutated in an inherited epilepsy of newborns. Nature genetics 18: 25. [View]
- Salyer SA et al., (2013) Vacuolar ATPase driven potassium transport in highly metastatic breast cancer cells. Biochimica et Biophysica Acta -Molecular Basis of Disease. 1832: 1734–1743. [View]
- Aspatwar A et al., (2010) Carbonic anhydrase related protein VIII and its role in neurodegeneration and cancer. Current pharmaceutical design 16: 3264–3276. [View]
- Akisawa Y et al., (2003) Expression of carbonic anhydrase-related protein CA-RP VIII in non-small cell lung cancer. Virchows Archiv 442: 66–70. [View]
- Pearce OM and H Läubli (2015) Sialic acids in cancer biology and immunity. Glycobiology 26: 111–128. [View]
- Ma R et al., (2016) miRNA–mRNA Interaction Network in Non-small Cell Lung Cancer. Interdisciplinary Sciences: Computational Life Sciences 8: 209–219. [View]
- Dong S et al., (2017) Bioinformatics insight into glycosyltransferase gene expression in gastric cancer: POFUT1 is a potential biomarker. Biochemical biophysical research communications 483: 171–177. [View]
- Westcott JM et al., (2015)An epigenetically distinct breast cancer cell subpopulation promotes collective invasion. The Journal of clinical investigation 125: 1927–1943. [View]
- Gadea G et al., (2008) DOCK10-mediated Cdc42 activation is necessary for amoeboid invasion of melanoma cells. Current biology 18: 1456–1465. [View]
- Ruiz-Lafuente N et al., (2015) Dock10, a Cdc42 and Rac1 GEF, induces loss of elongation, filopodia, and ruffles in cervical cancer epithelial HeLa cells. Biology open 4: 627–635. [View]
- Davies M and Y Samuels (2010) Analysis of the genome to personalize therapy for melanoma. Oncogene 29: 5545. [View]
- Trotter PJ and DR Voelker (1995) Identification of a non-mitochondrial phosphatidylserine decarboxylase activity (PSD2) in the yeast Saccharomyces cerevisiae. Journal of Biological Chemistry 270: 6062–6070. [View]
- Fahrmann JF et al., (2016) Serum phosphatidylethanolamine levels distinguish benign from malignant solitary pulmonary nodules and represent a potential diagnostic biomarker for lung cancer. Cancer Biomarkers 16: 609–617. [View]
- Nagarkatti-Gude N et al., (2012) Genetics of primary intraocular tumors. Ocular immunology and inflammation 20: 244–254. [View]
- Tomlinson VA et al., (2005) Translation elongation factor eEF1A2 is a potential oncoprotein that is overexpressed in two-thirds of breast tumours. BMC cancer. 5: 113. [View]
- Amiri A, F Noei, S Jeganathan, G Kulkarni, D E Pinke et al. (2007) eEF1A2 activates Akt and stimulates Akt-dependent actin remodeling, invasion and migration. Oncogene 26: 3027–3040. [View]
- Lee MH, Surh YJ (2009) eEF1A2 as a putative oncogene. Ann N Y Acad Sci 1171: 87–93. [View]
- Qiu, T, Wang H, WangY, Zhang Y, Hui Q, et al. (2015) Identification of genes associated with melanoma metastasis. The Kaohsiung Journal of Medical Sciences 31: 553–561. [View]
- Chung J, Franklin JF, Lee HJ (2019) Central expression of synaptophysin and synaptoporin in nociceptive afferent subtypes in the dorsal horn. Scientific reports 9: 4273. [View]
- Shiozaki, A, Shimizu H, Ichikawa D, Konishi H , Komatsu S, et al. (2014) Claudin 1 mediates tumor necrosis factor alpha-induced cell migration in human gastric cancer cells. World J Gastroenterol 20: 17863–17876. [View]
- Tiago Falcon , Martiela Freitas, Ana Carolina Mello, Laura Coutinho, Mario R Alvares-da-Silva, et al. (2018) Analysis of the cancer genome atlas data reveals novel putative ncRNAs targets in hepatocellular carcinoma. Biomed Res Int 2864120. [View]
- Hughes, S, Damato BE, Giddings I, Hiscott PS, Humphreys J, et al., (2005) Microarray comparative genomic hybridisation analysis of intraocular uveal melanomas identifies distinctive imbalances associated with loss of chromosome 3. Br J Cancer 93: 1191. [View]
- Liu, Y.-C, Heng-Chien Ho, Miau-Rong Lee, Kuang-Chi Lai, Chung-Min Yeh, et al. (2012) Early induction of cytokines/cytokine receptors and Cox2, and activation of NF-κB in 4-nitroquinoline 1-oxide-induced murine oral cancer model. Toxicol Appl Pharmacol 262: 107–116. [View]
- Solaini G, Sgarbi G, Baracca A (2011) Oxidative phosphorylation in cancer cells. Biochimica et Biophysica Acta –Bioenergetics 1807: 534–542. [View]
- Pirini F, Noazin S, Jahuira-Arias MH, Rodriguez-Torres S, Friess L, et al. (2017) Early detection of gastric cancer using global, genome-wide and IRF4, ELMO1, CLIP4 and MSC DNA methylation in endoscopic biopsies. Oncotarget 8: 38501. [View]
- Hoshijima M, Chien KR (2002) Mixed signals in heart failure: cancer rules. J Clin Invest 109: 849–855. [View]
- Deneka A, Korobeynikov V, Golemis EA (2015) Embryonal Fyn-associated substrate (EFS) and CASS4: The lesser-known CAS protein family members. Gene 570: 25–35. [View]
- Neumann LC, Weinhäusel A, Thomas S, Horsthemke B, Lohmann DR, et al. (2011) EFS shows biallelic methylation in uveal melanoma with poor prognosis as well as tissue-specific methylation. BMC cancer 11: 380. [View]
- Lee D, Dong-Soo S, Lee SC, Tigyi GJ, Kim JH (2018) Role of autotaxin in cancer stem cells. Cancer and Metastasis Reviews 37: 509–518. [View]
- Kong, B, Michalski CW, Hong X, Valkovskaya N, Rieder S, et al. (2010) AZGP1 is a tumor suppressor in pancreatic cancer inducing mesenchymal-to-epithelial transdifferentiation by inhibiting TGF-β-mediated ERK signaling. Oncogene 29: 5146–5418. [View]
- Pandiani C, Béranger GE, Leclerc J, Ballotti R, Bertolotto C, et al. (2017) Focus on cutaneous and uveal melanoma specificities. Genes Devep 31: 724–743. [View]
- Demirci H, Reed D, Elner VM (2013) Tissue-based microarray expression of genes predictive of metastasis in uveal melanoma and differentially expressed in metastatic uveal melanoma. J Ophthalmic Vis Res 8: 303–307. [View]
- Seung-Kyoon Kimac, Hae-RanJanga, Jeong-HwanKima, Seung-Moo Noh, dKyu-Sang Songe, et al. (2006) The epigenetic silencing of LIMS2 in gastric cancer and its inhibitory effect on cell migration. Biochemical and biophysical research communications 349: 1032–1040. [View]
- Patzig, J, Kusch K, Fledrich R, Eichel MA, Lüders KA, et al. (2016) Proteolipid protein modulates preservation of peripheral axons and premature death when myelin protein zero is lacking. Glia 64: 155–174. [View]
- Neman J, John Termini, b Sharon Wilczynski, c Nagarajan Vaidehi, d Cecilia Choy, et al. (2014) Human breast cancer metastases to the brain display GABAergic properties in the neural niche. Proc Natl Acad Sci U S A 111: 984–989. [View]
- Cheng, H, Terai M, Kageyama K, Ozaki S, McCue PA, et al. (2015) Paracrine Effect of NRG1 and HGF Drives Resistance to MEK Inhibitors in Metastatic Uveal Melanoma. Cancer Res 75: 2737–2748. [View]
- Tiwary S, M Preziosi, P G Rothberg, N Zeitouni, N Corson, et al. (2014) ERBB3 is required for metastasis formation of melanoma cells. Oncogenesis 3: 110. [View]
- Segers VFM, Dugaucquier L, Feyen E, Shakeri H, De Keulenaer GW (2020) The role of ErbB4 in cancer. Cell Oncol (Dordr) 43: 335–352. [View]
- Ercolano G, De Cicco P, Rubino V, Terrazzano G, Ruggiero G, et al. (2019) Knockdown of PTGS2 by CRISPR/CAS9 System Designates a New Potential Gene Target for Melanoma Treatment. Front Pharmacol 10: 1456. [View]
- Figueiredo A, Caissie AL, Callejo SA, McLean IW, Gold P, et al. (2003) Cyclooxygenase-2 expression in uveal melanoma: novel classification of mixed-cell-type tumours. Can J Ophthalmol 38: 352–356. [View]
- Lin, MC, J-J Lin, C-L Hsu, H-F Juan, P-J Lou, et al. (2017) GATA3 interacts with and stabilizes HIF-1alpha to enhance cancer cell invasiveness. Oncogene 36: 4243–4252. [View]
- Chatzinasiou, F, Lill CM, Kypreou K, Stefanaki I, Vasiliki Nicolaou V, et al. (2011) Comprehensive field synopsis and systematic meta-analyses of genetic association studies in cutaneous melanoma. J Natl Cancer Inst 103: 1227–1235. [View]